














Cost of Student Dropout Report

Student dropout represents a significant financial and reputational crisis for U.S. higher education institutions.
This issue of student attrition is driven by a number of complex factors, including financial pressures and psychological stress, which are particularly prevalent among the "New Majority" of non-traditional learners.
Key findings in Cost of Student Dropout report:
- $10.72 billion - cost of total student dropout (estimated total annual value)
- $4.85 billion - cost of first-year student dropout (estimated total
annual value) - $3.99 billion - public 4-year colleges see the highest annual student churn cost
- A 5% increase in first-year retention, and conservative 1 / 5 of that figure improvement across years 2+, would save an institution an average of $258,982 per year.
How to tackle student dropout
The report examines how scalable proactive measures and evidence-based technological solutions, like Genio Notes, can help institutions improve retention rates, protect their bottom line, and fulfill their core mission of supporting student success.
The scale of the problem
Student churn, or dropout, is a significant global challenge facing higher education. In the United States alone, the estimated total annual value of student dropout is an astronomical $10.72 billion ($10,722,721,453, to be exact), with first year students accounting for nearly half (45%, $4,850,753,771) of the total cost.
In this report we’ll cover the impact of churn on students and higher education institutions alongside the causes of this pervasive issue. Then, using data collected in the Integrated Postsecondary Education Data System (IPEDS), we’ll break down the scale of churn across the United States, looking at how institution type, Carnegie classification, state geography and first year status impact how learners persist. The report will finish by exploring options for reducing churn and improving student retention.
As students begin to question the value of a college qualification, and struggle to overcome a swathe of fundamental learning challenges, institutions, now more than ever, need to understand the macro and micro trends behind churn to ensure they’re financially robust to navigate their future.
Impact of dropout on students
A lack of retention is not merely a line item on a college's balance sheet; it's a real crisis with profound economic and social consequences. For the students who drop out, it often means accruing substantial financial debt without the career-enhancing benefit of a degree, often resulting in difficulties in the labor market.
It is estimated that over 65% of jobs today require some form of post-secondary credential, a figure projected to rise to 70% by 2027. If students are dropping out, and joining the "some college, no credential" (SCNC) population, which grew by 2.1 million (or 2.2%) from the start of the 2023 academic year, they are putting themselves at an economic disadvantage compared to peers who complete.
A staggering 75% of students also report moderate to severe psychological stress in higher education, demonstrating the negative health impacts the causes of dropout can bring to individuals seeking to advance themselves and improve their opportunities for prosperity.
Impact of dropout on institutions
For the institutions that students leave behind, the impact on their bottom line could be significant, particularly if the dropout problem isn’t fixed. With the ongoing enrollment shift, and increasing competition for learners, institutions need to adequately cater for and support the New Majority to, at minimum, keep the lights on.
A failure to do so represents reputational risk and a failure in their core mission. This can have a long term impact too as not only do the institutions lose their existing cohort, questions are raised by potential students looking for schools that are there to partner them through their education.
Combined with the proven economic influence that higher education has, there is significantly increased interest in measurable outcomes from policymakers, particularly regarding graduate employability. If students aren’t completing their credentials, questions will be raised around funding and viability.
To that end, there is a real need for higher education to rewrite the script, to turn churn into persistence, and prove the value of their qualifications for generations to come.
What is causing the national dropout problem?
Student churn is not a new phenomenon; according to the IPEDS data, the total dollar cost of churn has risen by 8.1% since 2013. There has always been a portion of the cohort that has, for one reason or another, not finished their course. The difference now is both the scale and motivations behind the rise in learners leaving higher education as part of the "Some College, No Credential" (SCNC) population.
A recent literature review presented a complex web of factors behind dropout intentions, ranging from the psychological to the financial, the social to the institutional. A key point to acknowledge is the inherent intersectionality of these factors, with many either causing, or being interwoven with another.
To begin to act on these, and understand the rationale behind these intentions, institutions must first understand the macro trends affecting their student cohort.
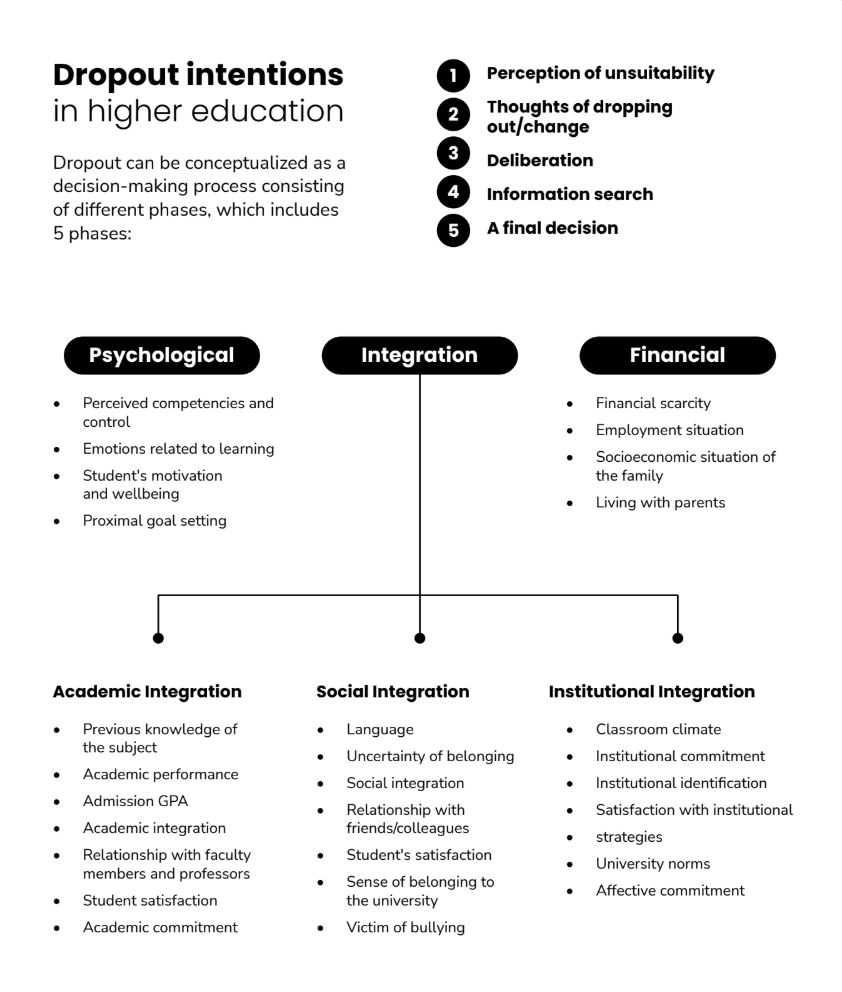
First and foremost, the average cost of college tuition in the U.S. has tripled over the past three decades, and national student loan debt has surpassed $1 trillion. As a result, some of the most influential factors impacting college access and college persistence rates are economic in nature.
Due to this swelling of investment, political and administrative decisions are pushing institutions to better prove their impact. Combined with cuts in funding where value can’t be proven, or valid workplace skills aren’t being clearly demonstrated, scrutiny on a national scale amplifies concerns over the purpose and value of the outlay.
With students having unrealistic expectations of college while simultaneously seeing opportunities for prosperity without a degree, it’s hardly surprising that the value of higher education is constantly being questioned.
But the causes of churn are not solely financial. Over the past few decades, there has been a clear enrollment shift that has drastically altered the demographic makeup of higher education. Non-traditional learners now constitute the New Majority, bringing with them a raft of challenges that increase their likelihood to churn.
Working students are financially unstable, meaning they may prioritize their employment over education. First-generation students are often lacking the social and cultural capital that helps set the foundations for their success. Part-time learners have a much lower credential completion rate of 33.7% compared to 67.2% for full-time peers, often due to conflicting priorities. Each characteristic of the New Majority can become a blocker in their journey to completion.
For institutions, these realities can be understood under the broad definition of three fundamental learning challenges; being time poor, underprepared or facing individual barriers. Collectively they fuel the disengagement cycle that drives student churn as identified in the Tinto Model.
This is particularly pertinent for community colleges who serve a much higher percentage of first-generation students (64%) compared to their four-year counterparts (47%) and colleges with a large neurodivergent cohort, where disengagement leaves them being 26% less likely to complete compared to their peers.
By addressing these issues at source, and adapting programs to better suit the needs and demands of the modern learner, retention rates will rise once more.
Student dropout across the United States
Utilizing the data collected in the Integrated Postsecondary Education Data System (IPEDS), we have researched the annual cost of student dropout across the United States, including how the problem persists across individual states, institution types and Carnegie classifications.
The findings don’t take into account federal funding or state funding differences. Nor was it practical to account for tuition variations in relation to in-state, out-of-state or international students, or whether programs are online or in-person. Were they to be included, evaluating funding amounts and an average churn % rate in the region of 25%, there could be an additional $30.25 billion at risk across the United States.
To that end, the figures presented are a conservative minimum. The actual totals will likely be significantly higher.
On a national scale, the estimated total value of student churn is $10,722,721,453 each and every year. This is calculated at the rate of years 2+ churning at 20% of the rate of the first year cohort. If years 2+ churned at a mere 5% higher rate, at 25% total, this value would be even greater, coming in at $12,190,713,374.
In terms of actual numbers, this equates to in excess of 1.25 million learners churning every year.
Evidently, the scale of churn is a significant cause for concern. In the following pages, we’ll dive into the details for how this national picture shakes out at a more granular level.
Full time enrollment (FTE)
FTE is a useful method of categorizing institutions, to provide a more focused picture. In this instance, the highest dollar amount lost belongs to institutions with an FTE in excess of 20,000, with these colleges losing $3,478,018,268 per annum.
This is somewhat to be expected, as there is a larger student population available to churn, and often higher fees associated with these colleges.
To that end, it is valuable to look not just at the total value of churn, but also at the percentage rate of churn. Here, the most significant concern lies for institutions with an FTE of less than 10,000 students which see a 9.6% rate of attrition. By contrast, for those with an FTE in excess of 20,000, the attrition rate is 5.6%.
Perhaps most alarming, for institutions with an FTE of 1,000 to 4,999 students, is that they have the second highest average attrition value, losing approximately $2,547,723,183 annually. Given the smaller student pool, revenue loss will likely hit harder not only on the balance sheet, but also in terms of institutional reputation, risking long term viability.
| FTE | FTE Churn % | Total Annual Student Churn |
|---|---|---|
| Under 1,000 | 9.3% | $945,041,448 |
| 1,000 - 4,999 | 9.6% | $2,547,723,183 |
| 5,000 - 9,999 | 9.6% | $1,846,352,603 |
| 10,000 - 19,999 | 8.4% | $1,858,813,752 |
| 20,000 and above | 5.6% | $3,478,018,268 |
Institution type and Carnegie classification
Considering institution type, it is the public 4-year colleges that see the highest total annual student churn cost at $3,990,937,704. This is closely followed by private nonprofit 4-year institutions where dropout accounts for a loss of $3,858,670,924.
Percentage wise, it’s a different story. Public less-than-2-year and public 2 year institutions see the highest % FTE churn at 15.5% and 15.2% respectively. These tend to be community colleges, where many students attend on a part-time basis and face a disproportionate burden of additional family responsibilities.
First-generation students, who are more prone to attrition due to a lack of cultural capital, are also more likely to initially enroll in public two-year institutions (46% compared to 26%) potentially explaining the higher figures, while also emphasizing the need to better support these more at-risk learners.
| Sector | FTE Churn % | Total Annual Student Churn |
|---|---|---|
| Public less-than-2-year | 15.5% | $24,260,173 |
| Private nonprofit less-than-2-year; Private for profit less-than-2-year | 9.2% | $268,845,920 |
| Private for profit 4-year | 9.5% | $1,044,182,236 |
| Private nonprofit 2-year; Private for profit 2-year | 10.2% | $425,115,819 |
| Public 2-year | 15.2% | $1,110,708,678 |
| Private nonprofit 4-year | 6.0% | $3,858,670,924 |
| Public 4-year | 5.7% | $3,990,937,704 |
For Carnegie classifications, specialized-business and management; tribal colleges and universities and associate’s colleges see highest FTE churn % at 11.7% and 11.5%.
There is likely a broader level of intersectionality with the high churn % rates at 2 year institutions and associate qualifications lasting 2 years, compounding the findings of the National Student Clearinghouse Research Center that put risk of churn on the radar of these Carnegie classifications.
| Carnegie | FTE Churn % |
|---|---|
| Doctoral/research universities-extensive | 3.5% |
| Other Specialized | 4.9% |
| Doctoral/research universities-intensive | 6.6% |
| Baccalaureate colleges-liberal arts | 7.6% |
| Master's colleges and universities I | 7.8% |
| Master's colleges and universities II | 8.3% |
| Baccalaureate/associate's colleges | 9.6% |
| Not degree-granting | 9.7% |
| Baccalaureate colleges-general | 10.4% |
| Associate's colleges | 11.5% |
| Specialized-business and management; Tribal colleges and universities | 11.7% |
State variations
As much as student churn is prevalent across the US, there is still significant geographical variation.
New Mexico (12.7%), New Hampshire (11.6%) and Hawaii (11.1%) have the highest FTE churn percentage of each state. By contrast Washington (3.8%), Florida (4.6%) and Massachusetts (5.1%) have the lowest FTE churn percentage.
Similarly, California ($844,039,980), New York ($794,084,680) and Texas ($710,109,601) have the highest total annual cost of student churn, reflecting their larger populations and volume of higher FTE schools, whereas Alaska ($9,982,673), Wyoming ($10,947,093) and South Dakota ($27,432,175) experience the lowest total annual cost of student churn.
First year students
First year students are particularly susceptible to dropout. The transition from high school to college is one of the most significant and demanding periods in a student's life, requiring new academic and social skills, increased independence, initiative, and self-regulation.
This critical first year is when decisions to stay or leave are most often made, and the foundations for effective learning are established. Levels of academic preparedness are vital indicators of a student’s likelihood to persist, with New Majority learners particularly susceptible to a lack of readiness that would otherwise enable them to adapt to their new college environment.
As such, first year churn accounts for a significant proportion of the problem, with the estimated annual value sitting at $4,850,753,771, or 45% of the national total.
Interestingly, the data shows a weak national relationship between New Majority student enrollment and FTE student percentages. This indicates that student churn is a challenge for institutions regardless of their New Majority population size.
Looking more closely at the data, the most vulnerable size FTE is 5,000 to 9,999 who see a 31% churn rate but it is still those colleges with an FTE of 1,000 to 4,999 who are disproportionately affected, seeing 30% churn rates and a loss of $1,269,897,292.
| FTE | FTE Churn % | Total Annual Student Churn |
|---|---|---|
| Under 1,000 | 29.6% | $496,601,801 |
| 1,000 - 4,999 | 30.0% | $1,269,897,292 |
| 5,000 - 9,999 | 31.0% | $868,220,546 |
| 10,000 - 19,999 | 27.3% | $842,028,640 |
| 20,000 and above | 16.9% | $1,345,974,271 |
The only factor where the national pattern for first-year churn doesn't hold true is when you examine it by institution type.
Here, private for profit 4-year institutions see the highest % FTE churn at 41.7% while public 4-year colleges see the highest total annual student churn cost at $1,922,800,437.
This appears contradictory to other trends, further complicating the picture of churn and potentially owing to the higher academic demands, and mounting strain, for learners studying for more than 2 years.
| Sector | FTE Churn % | Total Annual Student Churn |
|---|---|---|
| Public less-than-2-year | 35.5% | $18,687,125 |
| Private nonprofit less-than-2-year; Private for profit less-than-2-year | 25.5% | $169,429,415 |
| Private for profit 4-year | 41.7% | $170,614,308 |
| Private nonprofit 2-year; Private for profit 2-year | 29.6% | $223,908,926 |
| Public 2-year | 40.4% | $663,053,706 |
| Private nonprofit 4-year | 19.2% | $1,682,259,855 |
| Public 4-year | 18.6% | $1,922,800,437 |
Across Carnegie classifications, specialized-business and management; Tribal colleges and universities again see the highest FTE churn % at 44.8% but each classification type is in excess of 10%.
Even where there is comparative success, the magnitude and ubiquitous nature of the problem is evident.
| Carnegie | FTE Churn % |
|---|---|
| Baccalaureate/associate's colleges | 34.1% |
| Specialized-business and management; Tribal colleges and universities | 44.8% |
| Master's colleges and universities II | 26.3% |
| Other Specialized | 19.2% |
| Baccalaureate colleges-liberal arts | 18.5% |
| Baccalaureate colleges-general | 29.5% |
| Doctoral/research universities-intensive | 20.4% |
| Not degree-granting | 31.2% |
| Associate's colleges | 40.2% |
| Doctoral/research universities-extensive | 11.1% |
| Master's colleges and universities I | 23.2% |
At a state level, New Mexico (37.3%), New Hampshire (35.2%) and Hawaii (32.9%) have the highest FTE churn % of each state mirroring their national rankings. On the other end of the spectrum Washington (18.1%), Massachusetts (18.2%) and Delaware (18.6%) have the lowest FTE churn % but are still registering close to a 1 in 5 dropout rate.
Looking at revenue alone, once again, New York ($389,386,671), Texas ($357,669,768) and California (338,403,559) have the highest total annual cost of student churn while Alaska ($3,664,164), Wyoming ($5,785,521) and South Dakota ($14,585,107) have the lowest total annual cost.
In each of these states first year churn accounts for nearly 50% of total revenue loss.
The bottom line
Putting this all into perspective, and looking holistically at the scale of the issue once more, the total number of learners across the United States, who churn every single year, is in excess of 1.25 million learners (1,260,639 to be exact).
A 5% increase in first-year retention, and conservative 1 / 5 of that figure improvement across years 2+, would save over 75,000 students from dropping out.
These are the individuals that your institution can be saving.
Download the report below to discover how your institution can tackle student dropout
Share this resource





Empower learners of all abilities
Talk to us about how Genio Notes can support and improve note taking skills.

More from Guides and Whitepapers
View All.png)
Learner Impact Report 2025
Our 2025 Learner Impact Report explores how Genio Notes empowers students to thrive, drawing from data from hundreds of students across the United States.

New Majority Learner Report 2025
More higher education students than ever before are juggling college with work, family, and other responsibilities. Delve into the challenges and motivations of these New Majority Learners.
.png)
The Genio Grades Challenge 2024
This free report shows the result of our latest survey where we asked learners how Genio Notes was affecting their studies and their grades.