






Executive summary:

  • Student dropout costs U.S. higher education $10.31 billion annually
  • First-year drop out accounts for $4.67 billion annually
  • Rising tuition fees are making individual student departures increasingly expensive for institutions to absorb
  • Traditional campus support systems miss 85% of those experiencing academic challenges that contribute to dropout
  • A multi-intervention approach to persistence is required to equip advisors with the early-warning analytics needed to proactively prevent dropouts

The state of play: student dropout in the United States

ILL_SCALE compare analysis weigh vs tech

Dropout poses an acute crisis for U.S. higher education institutions. The total national value of lost tuition stands at a staggering $10.31 billion, with first-year attrition accounting for 45% of the total financial hit, at $4.67 billion.

The latest data reveals that a 7.14% decline in dropout volume yielded just a 3.64% reduction in financial loss in the 2023/24 academic year, demonstrating that individual departures are becoming significantly more expensive for institutions to absorb.

Despite the scale of the problem, there is a clear return on investment for successful intervention methods. A 5% increase in first-year retention, with a conservative improvement of 1% of that figure for subsequent years, could save an institution an average of $498,386 per year.

Achieving these savings requires looking beyond macro numbers alone, and instead looking directly at the students at the heart of the issue. New Majority Learners form the definitive majority on campus, with nearly 70% of students working while studying, over 40% over the age of 22, and 20% managing English as an additional language.

Rather than navigating a singular hurdle, these learners encounter a complex, highly intersectional set of systemic pressures. They are frequently time-poor, academically underprepared, or navigating distinct structural and cognitive learning barriers.

Traditional intervention models often rely on students' self-signaling, which can inadvertently introduce barriers for New Majority Learners who are balancing competing responsibilities and challenges.

The reality is that 85% of students experiencing academic challenges won’t seek help, but even a single advising interaction can increase a student’s likelihood of persisting by 18%.

Shifting institutional focus toward building independent study confidence in at-risk learners yields dividends far beyond recaptured tuition.

For students, it fosters increases in academic self-efficacy, a proven driver for retention. For student success teams, it replaces reactive interventions with measurable, scalable early alert systems. Ultimately, these combined gains turn the tide on student dropout, cementing institutions’ reputations as champions of equitable persistence and success.

Genio illustrations_barriers to learning

Back to top

How is enrollment changing in the United States, and how does it impact dropout rates?

Between the 2023 and 2024 academic years, Fall enrollment held steady, with an incoming cohort of approximately 2.6 million learners.

Yet over the same period, tuition rates increased by an average of 2.85%. This divergence between flat enrollment volume and inflating tuition means that despite fewer students leaving, the cost per dropout is higher.

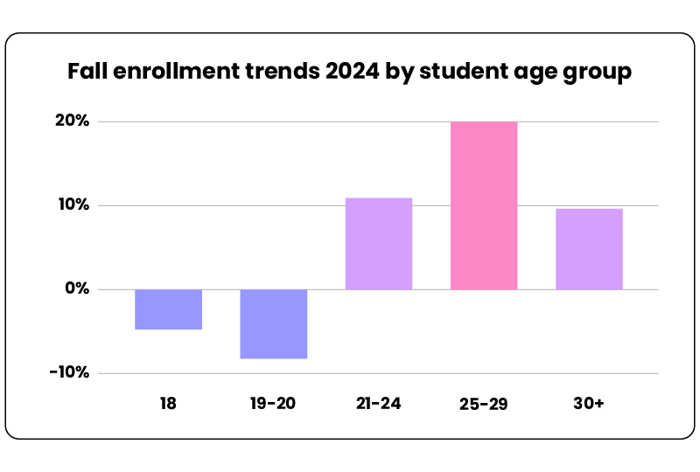
Enrollment data from this period confirms a further demographic shift toward New Majority Learners, highlighted by a 20.9% year-on-year rise in students disclosing a disability and a 10% rise in stopped-out students re-enrolling. Colleges are also seeing an unprecedented fall in ‘traditional’ post-high school starters. First-year enrollment among 18-year-olds declined 5.8% year on year, while enrollment among students ages 25 to 29 grew 20% over the same period.
COSD 2026 graphs_enrollment

This creates a high-stakes environment. For institutions, whose bottom lines are becoming increasingly precarious, every loss of this vulnerable cohort carries an unprecedented financial penalty. For New Majority Learners who may not have the financial safety nets of saving buffers or familial support, an unexpected expense or administrative hurdle could force a dropout.

Those who do drop out are frequently left with the compounding burden of lingering debt without the offsetting career mobility of a degree. Nationally, nearly 60% of student borrowers who leave higher education without graduating ultimately default on their loans, a rate more than double that of graduates.

These individuals invariably join the expanding "Some College, No Credential" population, which now encompasses over 43 million U.S. adults earning roughly 35% less per year than degree holders while facing nearly double the unemployment rate. Compounding this volatility is the stark reality that once a student drops out, the statistical likelihood of them ever re-enrolling is profoundly small, with a re-enrollment rate of just 2.7%.

Student dropout across
the United States

On a national scale, the estimated total value of student dropout is $10.31 billion each year, equating to over 1.17 million learners prematurely leaving the higher education system.

With first-year dropout accounting for just under half of the total financial deficit, at $4.47 billion, data indicates that dropout slows after the first year.

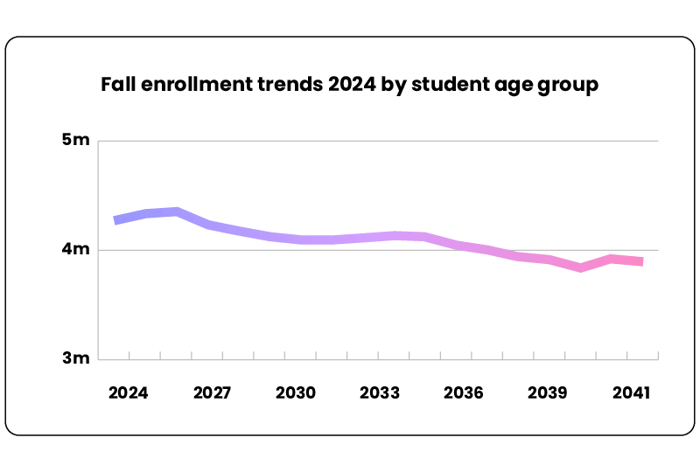
As the demographic of the population continues to change, with the US set to have 650,000 fewer 18-year olds by 2039 than it does today, universities and colleges must be proactive in meeting the needs of their evolving cohort, to bridge the persistence gap and maintain financial health.
COSD 2026 graphs_age group

This report utilizes data from the Integrated Postsecondary Education Data System (IPEDS) to map the exact architecture of student dropout across the United States, breaking down the crisis by institution type, Carnegie classification, and state geography.

The findings don’t take into account federal funding or state funding differences. Nor was it practical to account for tuition variations in relation to in-state, out-of-state, or international students, or whether programs are online or in-person. To that end, the figures presented are a conservative minimum. The actual totals will likely be significantly higher.

Back to top

How does student dropout vary according to enrollment?

In terms of raw volume, the nation’s largest universities, those with a full-time
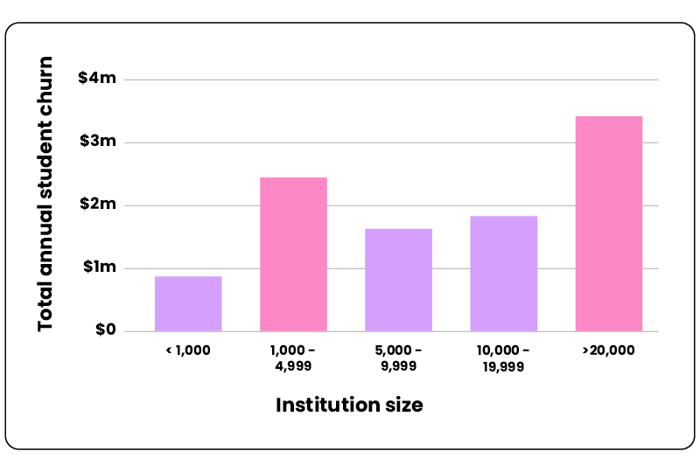
enrollment (FTE) exceeding 20,000, experience the heaviest fiscal hit, losing a total of $4.42 billion annually from students who drop out. This total is driven by large student bodies and higher baseline fees.

However, narrowing in on first-year full-time dropout percentages exposes an entirely different crisis. While the overall dropout rate for first-year, full-time students stands at 27%, the true operational strain sits heavily with mid-sized and smaller footprint institutions.

While bigger institutions often have large endowments to offer comprehensive emergency grants, robust advising, and financial safety nets, mid-sized campuses often operate on thin margins, limiting their ability to deploy high-cost retention intervention models.
COSD 2026 graphs_churn v size

Those with 5,000 to 9,999 FTE experience a first-year full-time dropout rate of 31%, and a part-time dropout rate of 48% - the highest of any institution size. However overall, the most severe structural threat continues to converge on the 1,000 to 4,999 FTE cohort. These campuses endure high levels of departures, while sustaining the second-highest total financial drain in the country at $2.44 billion.

Because these smaller institutions lack the safety net of a massive student body, losing this level of revenue strikes a catastrophic blow to their balance sheets and regional reputations, ultimately threatening their long-term operational viability.

Back to top

How does student dropout vary according to institution type and Carnegie classification?

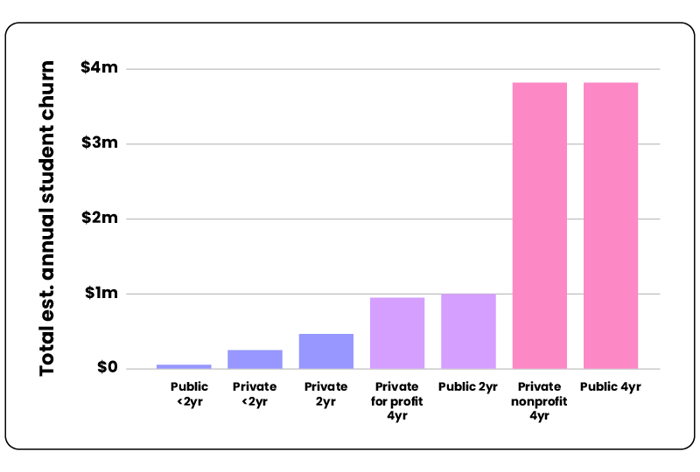
Public 4-year colleges see the highest total annual student churn at $3.83 billion, accounting for 37% of the overall churn in the United States. This is closely followed by private nonprofit 4-year institutions where dropout accounts for a loss of $3.81 billion.

Public 2-year institutions, which tend to be community colleges, see the highest percentage FTE churn, at 13.5% - an improvement of 1.7% year-on-year. However, IPEDS data reveals that total Fall enrollment across public 2-year colleges actually fell by 3.8% in the same period, resulting in a loss of 29,245 students.

This highlights a pipeline vs persistence problem affecting community colleges. While the improvement in churn indicates that community colleges are successfully retaining more students, this victory is wiped out by the decline in Fall enrollment.
COSD 2026 graphs_institution type

For Carnegie classifications, baccalaureate colleges see the highest FTE churn percentage at 10.3%, as would be expected due to their 4+ year degree duration. This is closely followed by associate colleges, with an overall FTE churn of 9.6%, and a staggering first-year drop out rate of 36.6%. This once again demonstrates the vulnerability of community colleges.

A recent survey of community college dropouts found that 45% cited financial hardship as their primary reason for departure, while academic challenges (39%) and stress (33%) followed as the most common reasons for departure. This firmly aligns with the factors that disproportionately impact New Majority Learners: time-poverty, academic underpreparedness and additional learning barriers.

Back to top

How does student dropout vary according to state?

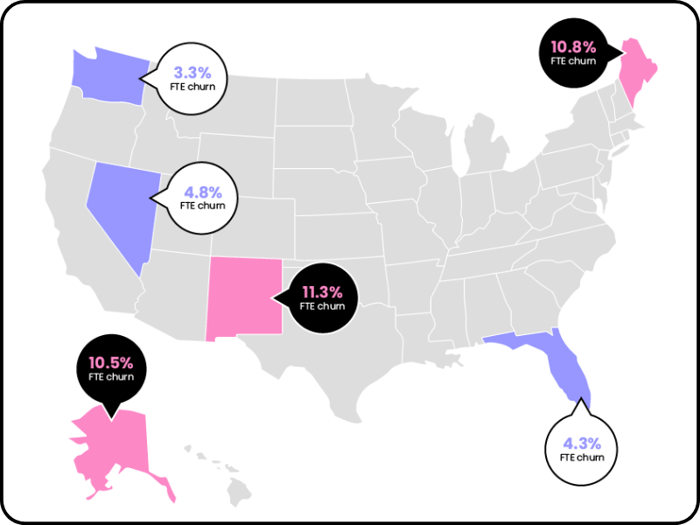
The differences in geographical dropout rates are significant. New Mexico (11.3%), Maine (10.8%), and Alaska (10.5%) have the highest FTE churn percentages by state, compared
to Washington (3.3%), Florida (4.3%), and Nevada (4.8%), who come in at the lowest.

In terms of monetary losses, California ($779.9 million), New York ($775.7 million), and Texas ($675.2 million) have the highest total cost of student churn, reflecting their large volume of institutions. Conversely, Wyoming ($9.7 million), Alaska ($15.7 million), and South Dakota ($25.9 million) record the lowest total cost of dropouts.

Data from the State Higher Education Executive Officers Association (SHEEO) reveals that the states achieving the lowest FTE churn percentages, such as Washington and Florida, are among the top ten highest-funded states in the country, allocating $3.4 billion and $7.7 billion to higher education respectively.
COSD 2026 graphs map

This demonstrates that robust public investment contributes to a buffer against student dropout, enabling states to build the stable foundational resources needed to keep students enrolled.

Indeed, the states experiencing the highest churn percentages, like New Mexico and Alaska, operate with much smaller baseline budgets that fall far below these multi-billion-dollar funding tiers. 


Back to top

Why are New Majority Learners disproportionately more likely to drop out?

Dropout is rarely the result of a single, sudden academic failure.

Research demonstrates that 21% of first-year students who drop out maintain a GPA between 2.5 and 3.0. A GPA within this range indicates that students are academically secure, and their decision to drop out therefore cannot be attributed to a deficit in learning capability, or a failure to comprehend course material.

Instead, it is a gradual process of disengagement driven by a number of compounding factors:

Mental health strain

Emotional stress (54%) and mental health concerns (43%) are the most prevalent reasons students cite for dropping out.

Financial instability

Nearly 60% of undergraduates consider dropping out due to financial pressures as the overall cost of higher education escalates.

Erosion of academic self‑efficacy (ASE)

Defined as a student's belief in their capacity to succeed, ASE is the single most influential driver of retention. When structural hurdles lower baseline confidence, routine academic tasks can transform into sources of severe anxiety.

Non‑help‑seeking behaviour

Legacy intervention models rely on students self-identifying, yet 85% of students facing academic or personal challenges will never actively ask for help.


This structural risk is heavily concentrated among New Majority Learners, who now represent the most vulnerable demographic on campus. For these students, a passing grade is a necessary but ultimately insufficient condition for persistence.

Instead, they navigate disproportionate levels of material instability - including housing insecurity, food scarcity, transportation barriers, and childcare responsibilities - as well as time poverty and academic underpreparedness.

Rather than acting as isolated incidents, these compounding vulnerabilities exert a heavy attrition load on the student. In fact, students experiencing four unmet basic needs exhibit 82% greater odds of encountering a dropout indicator compared to peers with zero unmet needs.

Back to top

Addressing student dropout with academic self-efficacy

ILL_mental health adhd autism process notes research dominoes book

While personalized interventions have been shown to increase graduation rates among at-risk students by up to 60%, traditional support frameworks rely largely on students self-signaling their struggle.

For New Majority Learners, this requirement creates a bottleneck. Traditional campus architecture operates on the assumption of an unencumbered student body, yet a learner balancing a 30-hour workweek or family care, on top of their studies, is often too time-poor to attend in-person office hours.

Beyond logistical friction, deep psychological barriers reinforce this isolation. First-generation students frequently experience high levels of self-stigma, viewing help-seeking as confirmation of personal inadequacy rather than a standard learning strategy.

Similarly, concerns around confidentiality are more prevalent among disabled, international, and ethnic minority students, who worry that seeking support may be weaponized against them.

Exacerbated by imposter syndrome, New Majority Learners often resort to hyper-self-reliance or "passive help-seeking", waiting quietly in the hope that an educator notices their distress.

This dynamic creates a massive institutional blind spot, resulting in 85% of college students experiencing academic challenges never actively asking for help. This issue is particularly acute among the "murky middle".

These are students who maintain a first-year GPA between 2.0 and 3.0 but frequently slip off the radar because their passing grades mask their vulnerability. An EAB study found that nearly one-third of students in this bracket go on to drop out during their second year or beyond.

Because legacy early-alert systems only trigger when a student is visibly failing, they are fundamentally too reactive to support those who choose not to self-identify. Stabilizing persistence therefore requires shifting institutional focus to a different indicator of student persistence.

Research demonstrates that when isolating personal and social variables, academic self-efficacy emerges as the single strongest predictor of college retention, comfortably outperforming highly touted metrics like institutional loyalty or clarity of career goals. 

In short, a student's belief in their own capability to succeed is a far more powerful retention tool than their desire for a degree. This reality represents a major paradigm shift for campus leadership.

Academic performance is only half of the persistence equation; if an institution fails to support a student's psychological capacity to navigate challenges, it neglects the primary variable determining their survival.

Rather than waiting for low grades to trigger a reactive alert, institutions must embed scalable tools that continuously build academic self-efficacy within a student's daily workflow. 

Genio illustrations_employee experience

Back to top

How to embed support to boost student persistence

There is no singular ‘quick fix’ that can solve the complex, multi-layered problem of
dropout. However, by nurturing academic self-efficacy, institutions can focus on a
tangible and measurable lever that is directly linked to increased persistence.

The best-supported students tend to be at institutions that layer several methods and interventions together:

ICON-lightbulb-1

Early alert systems that provide institutions with visibility of students who are academically slipping or underperforming

An Oklahoma State University study found that retention increased by 30% in students who were signed up to early academic alerts.

ICON NOBG_magazine

Supplemental instruction to reach students who might not book a standalone appointment but will participate in a session attached to their course

A research study found that supplemental instruction has a positive impact on community college students’ perspectives of their academic achievement, student retention, and success.

ICON-seedlings

Belonging initiatives that build the social trust that make students feel more confident to ask for help

Research shows that students, especially first-generation students, who encounter bureaucratic hassles like confusing financial aid or course selection forms are less likely to remain enrolled compared with peers who feel a stronger sense of belonging.

Yet, despite their value, these programs still require overextended students to raise their hands and self-advocate. To complete this ecosystem, institutions require a fourth layer of frictionless support embedded directly into the student’s daily learning environment.

Accessible directly through the campus Learning Management System (LMS) via single sign-on, Genio removes administrative hurdles and the need to self-identify.

Non-help-seekers can privately master course concepts and build study skills on their own terms, rewiring their internal confidence. Indeed, over 70% of students using Genio Notes show a measurable increase in academic self-efficacy, with the greatest gains occurring among neurodivergent learners navigating ADHD, dyslexia, or processing differences.

Crucially, this embedded model also solves a core operational hurdle, ensuring that non help-seeking students are made visible to their institution. As students engage with Genio’s study tools, their activity generates empirical usage data. Advisors gain real-time visibility into silent disengagement before grades drop, enabling them to initiate timely, personalized outreach.

Proactively scaling these data-informed touchpoints is critical to stabilizing enrollment, as a single advising interaction increases a student’s likelihood of persisting by 18%. By adding embedded learning technology to their broader retention strategy, institutions can privately build student confidence while equipping advisors to rescue at-risk learners before they quietly exit.

Back to top

Conclusions

The rising cost of attendance has fundamentally altered the economics of student retention.

In an era of flat enrollment and climbing tuition fees, individual student departures carry a far heavier financial impact than ever before.

To be financially sustainable, higher education cannot afford to continue to absorb a national $10.31 billion dropout drain, nearly half of which occurs during the high-stakes first year alone. Yet, the traditional playbook for preventing this loss remains structurally flawed. Relying on struggling students to seek out campus services will not effectively tackle dropout, when 85% of academically challenged students will never actively ask for help.

For the rising majority of today's students, who are balancing work, family, and invisible learning differences, traditional support structures act as a barrier to non-help-seeking students, rather than a bridge. This creates a silent attrition gap, and once they leave, the door is almost always closed for good, with the subsequent re-enrollment rate for this population a bleak 2.7%.

The key to reversing this pattern is not to completely rewrite the institutional playbook, but to focus on the single most powerful psychological lever linked to persistence academic self-efficacy. 

By replacing high-barrier, reactive interventions with frictionless study tools, universities can build this confidence privately, on the student’s own terms.

While students build confidence, they generate empirical engagement data that renders historically invisible learners visible to the institution. By tracking these patterns, advisors can proactively target their outreach, scaling the powerful ‘touchpoint effect’ where even a single advising interaction increases a student’s likelihood of persisting by 18%.

The return on this strategic pivot is clear. A modest 5% increase in freshman retention, combined with a 1% improvement in the years that follow, would yield an average annual saving of $498,386 per institution in recaptured tuition alone.

The return on investment, in reality, is likely to be much higher. A prime example is Volunteer State Community College, who saw a huge 11% improvement in student persistence among Genio users. By shifting from reactive, high-barrier interventions to passive, confidence-building learning scaffolds, higher education leaders can protect their enrollment, stabilize their budgets, and deliver on the promise of student success.


Download the full Cost of Student Dropout Report and discover ways your institution can benefit from Genio Notes

Back to top

Methodology

This report offers a comprehensive analysis of student churn rates across higher education in the United States. To achieve this, our research team embarked on a rigorous data collection and analysis process, drawing insights from key sources and employing innovative methodologies.

Data sources and informed assumptions

Our investigation primarily utilized the data collected in the Integrated Postsecondary Education Data System (IPEDS). Where possible, data from the 2023 survey was used but in instances of missing information, the 2022 survey was employed as the alternative.

IPEDS, with its institution-level data, served as the cornerstone of our research, allowing us to evaluate full-time and part-time student cohorts, with a  deeper level of detail in the form of first-year breakdowns. Alongside this, the data set provides retention data for each institution as well as average fees per FTE.

Owing to institution-level variations, necessary assumptions were required to calculate the role part-time students had on total figures. As such, figures were calculated with two part-time students equating to one full-time student.

Further assumptions were made regarding the churn rates for students in years 2+, with a conservative yardstick of 20% of first-year churn rates used to calculate overall institutional figures.

Likewise, geographical variations are particularly nuanced. The report doesn’t take into account federal funding or state funding differences. Nor is it practical to account for tuition variations in relation to in-state, out-of-state or international students, or whether programs are online or in-person.

To that end, the figures presented are a conservative minimum, the actual totals will likely be significantly higher.

Genio impact

When calculating the impact Genio could have on both financial savings and the number of students saved from dropping out, benchmarking based on proven results, such as those at Volunteer State Community College, were used to generate an average expected output.

This methodology underscores Genio's commitment to delivering data-driven insights that empower institutions to better understand and serve the needs of their learners.

By shedding light on the scale of student churn and the associated costs, Genio aims to provide a valuable roadmap for navigating the future of higher education, thereby increasing retention and improving student outcomes.